3. Functional Requirements
3.1. Input
- A valid submitted gene expression file has the following format:
- It is a TAB-delimited, plain text file with three columns;
- The file contains an optional head line, followed by each gene’sexpression in a control sample (e.g., ControlSample) and in a treatment sample(e.g.,KnockOutSample).
See the txt file pattern as following:
gene_id ControlSample KnockOutSample AT1G01010 1.198558083 2.036161827 AT1G01020 13.75736234 13.370796 AT1G01030 0.833779536 0.203616183 AT1G01040 9.58846466 7.126566394 AT1G01046 0 0 AT1G01050 23.81482799 21.10821094 AT1G01060 0.625334652 1.221697096 AT1G01070 1.719670292 0.950208853 AT1G01080 28.34850421 25.24840665 AT1G01090 58.26034505 42.96301455 AT1G01100 1066.508249 1308.030358 AT1G01110 2.709783491 1.425313279
3.2. Output(Data Analyzing)
The web application displays a table and a scatter plot when given a gene expression file.
3.2.1. Table Analyzing
The table contains a list of differentially expressed genes with the following format:
gene_id control_sample knockout_sample log_2[FC] AT1G01010 1.198558083 2.036161827 0.76
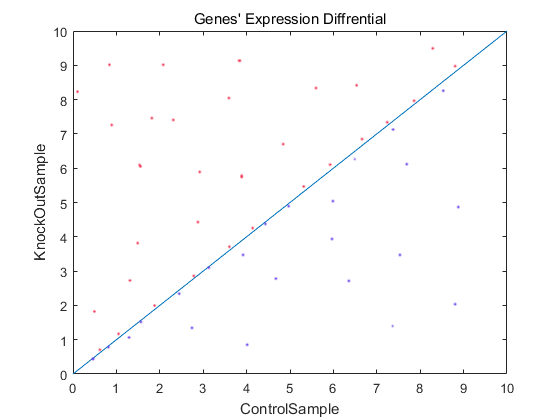
3.2.2. Plot Analyzing
The scatter plot displays differentially expressed genes. The X-axis is Control, and Y-axis is KnockOut. Replace ‘Control’ and ‘KnockOut’ with appropriated column names if provided in the uploaded file. The up-regulated genes are shown in red dots, and down-regulated genes are shown in blue.